Track costs and reduce paper waste
The volume of printing that occurs in an office can be surprising. One of the best ways to cut down unnecessary costs is to ensure users print only what they need. uniFLOW Online helps administrators take complete control of printing, copying, faxing and scanning activities.
Print and copy accounting
Multiple price profiles can be created to reflect different costs for different printers. Following identification, additional copies or scans made on the device can be allocated to the correct user, department and device. Print jobs originating on a PC are tracked according to the user or department login details.
With ULM-enabled Canon devices, job logs are collated (using CPCA) and sent to the uniFLOW Online portal to compile the reports. With non-Canon devices connected to a uniFLOW Release Station, print/ copy data is forwarded by the uniFLOW SmartClient; A copy cable is required to enable copy counting on non-Canon devices.
When uniFLOW Online is used as an accounting-only solution, it can also record completed jobs printed on other devices; the uniFLOW SmartClient can forward the accounting information to the uniFLOW Online portal. Print job titles are sent to the uniFLOW Online portal although the administrator can configure this information to be excluded in any reporting.
For more information on the uniFLOW SmartClient, click here.
Cost allocation using cost centers
The first step to cut down unnecessary costs is the allocation of costs. Cost centers, also known as billing codes or cases, allow print, scan or copy charges to be allocated to different projects or cases. They can be assigned on a per-job basis or by default according to user, device or location. The cost center extension allows the creation and management of cost centers. Access to cost centers can be restricted on a per-user/ per-group basis, ensuring users only see those cost centers relevant to them at the device. Following identification, additional copies or scans made on the device can also be allocated to the correct user, department and device. Allocation of costs can highlight expenditure by users and pinpoint areas where costs can be scaled down.
Using widgets to gain a good system overview
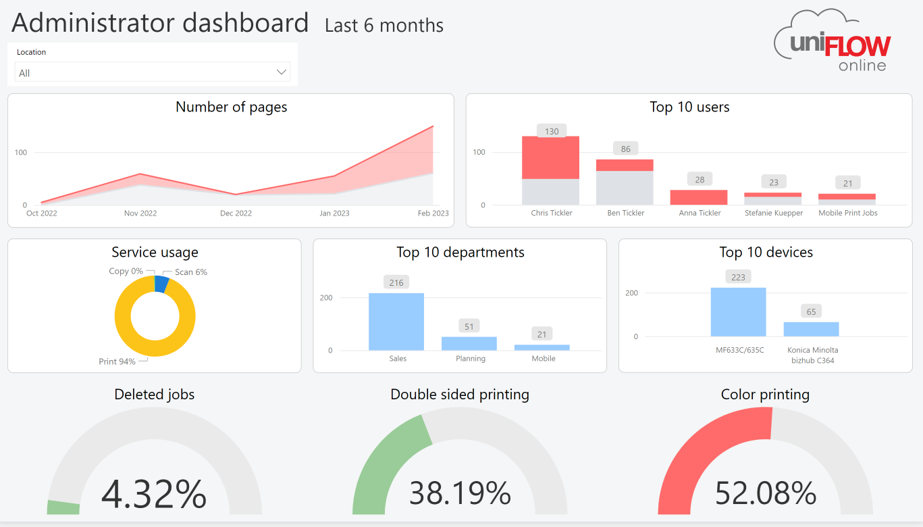
Within uniFLOW Online, widgets that collect and visualize data from various uniFLOW Online pages are located on the dashboard. One can differentiate between administrator and user dashboards. Using the accounting widget, the administrator is presented with the option to quickly check information such as print volume and compare black/white print volume against color print volume. This structured overview of the organization's print and scan habits allows for a fast reaction to cut costs and streamline print processes. Users are shown their own print activities and volume on the dashboard i.e. raising awareness of print consumption and behavior.
Graphical reporting data
Information on business' print, copy, fax and scan usage is useless unless this information can be collated into reports. The uniFLOW Online portal contains graphical report types that a customer can create - user details, device details and summary, sampling by department and many more. Report contents can be changed instantly by selecting filters e.g. specific users, groups, printers or date ranges. Filtering per location is also possible, quickly generating an overview for a particular location. Summary reports display the previous year's data and sampling reports show data of the last six months.
All data from these reports and monthly raw data of the last six months can be easily exported every month. In addition, it is possible to export the data to various cloud storage services automatically. Next to this, reports can also be generated based on a schedule and automatically emailed as a .csv file to multiple recipients. Report schedules can be created for the various summary and sampling reports or the device volume report. The data in .csv format integrates perfectly with business analytics tools, allowing businesses to create their own reports and retain print data with other business analytic data centrally together.

Seamless integration with Microsoft Power BI
Power BI allows businesses to consolidate data from various sources in one tool. uniFLOW Online enables the automated export of all printing-related data to Power BI. Consolidate data and transform reports visually to revolutionize how you use and present your data.
Supported functionality
- 2 Power BI templates are available: local folder and SharePoint Online/ OneDrive for Business.
- Automatic refresh of Power BI data.
- Combine data from multiple tenants in a single Power BI report.
 |


